Introduction
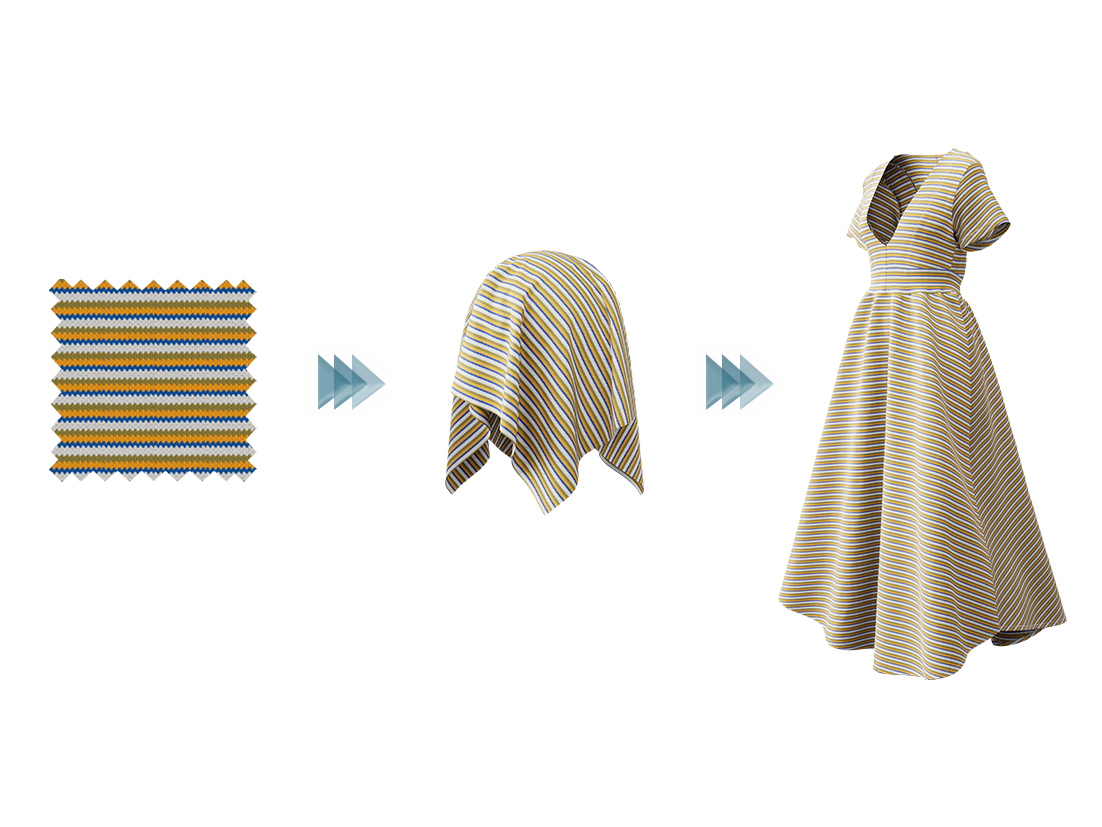
In recent years the apparel industry has witnessed an increase in the adoption of 3D virtual design, largely driven by advancements in simulation and digitization technologies. Central to this transformation are digital twins, virtual replicas of real garments, which offer designers the ability to prototype and iterate without having to manipulate real materials.
Understanding how different fabrics will hang or fold is not just an aesthetic consideration. It also impacts functionality, comfort, and performance. For this reason, the drape properties of fabrics must be digitized to accurately replicate their real word behavior. The effectiveness of these digital twins hinges on their ability to closely match the real garment.
This is typically done by performing mechanical tests on multiple fabric samples with specialized hardware. This approach has the potential of being highly accurate if done properly, but requires significant effort as well as access to fabric samples, therefore making it a complex and expensive process. SEDDI Textura on the other hand, leverages AI to perform this digitization with fabric metadata and a flatbed scanned image of the fabric, avoiding the cost and time investments of fabric sample testing and transport.
Some questions naturally arise: how can we validate that a digital fabric agrees with its real-life counterpart? How do we measure its accuracy, and therefore how can we quantify drape in a meaningful way?
In this document, we’ll approach these questions by examining the principles behind the Cusick Drape Test, a popular method to understand the drape behavior of fabrics, and how it can be used to evaluate SEDDI’s advancements in fabric drape prediction.
Fabric Drape Quantification: The Cusick Test
The apparel industry has developed different ways to quantify fabric drape. These methods vary in complexity, equipment requirements, and the insights they provide into fabric behavior. One particularly interesting method is the Cusick Drape Test.
The Cusick Drape Test is a commonly used method for testing textiles. The procedure itself is defined by the International Organization for Standardization (ISO) in their ISO 9073-9:2008 standard. It provides a high-level quantitative measure of a fabric’s drape, known as the drape coefficient (DC) or drape ratio.During the test, a circular fabric sample is allowed to drape over a support disk solely under its own weight. Specialized equipment (Figure 1), including a well-positioned light source and a parabolic mirror, is used to measure the shadow cast by the draped fabric from below. The drape coefficient is then calculated as a percentage, derived from the ratio of the shadow area to the area of the original circular fabric piece (Figure 2).


Figure 1. Left: Diagram of a Cusick Drape meter. Right: Photographs of a drape meter at various stages of measurement. The fabric specimen (1) is supported by two concentric disks and allowed to fold under its own weight. A light is projected from beneath the specimen (2) and reflected on a parabolic mirror (3), creating a shadow (4) on a sheet of paper, which is then used to calculate the drape coefficient.
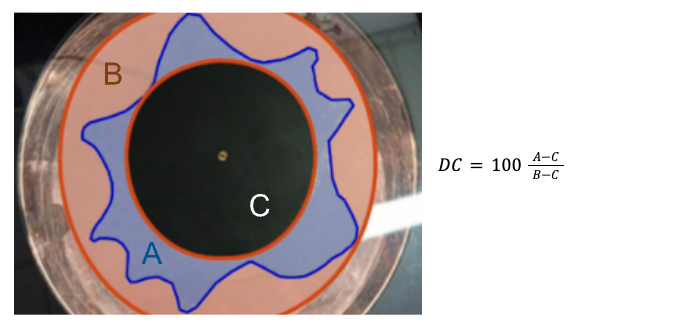
Figure 2. Computation of the Cusick Drape Coefficient (DC%). The coefficient is derived from the ratio of the shadowed area (A – C) to the original circular fabric piece (B – C).
Several factors influence a fabric’s drape coefficient: stiffness, density, thickness, structure, composition, etc. In overall terms:
- Fabrics with greater flexibility and lighter weight typically exhibit lower drape coefficients, indicating more drapability.
- Conversely, thicker, denser, and stiffer fabrics tend to have higher drape coefficients, suggesting less drape characteristics.
The drape coefficient has its limitations. For example, it only captures the global draping behavior and misses directional effects like anisotropy that can influence drape shape. However, its simplicity and effectiveness in quickly assessing fabric behavior have made it a very practical tool.
AI-powered Mechanical Digitization with SEDDI Textura
For digital fabrics to meet the fidelity standards necessary for garment design processes, they must be able to faithfully replicate the fabric’s mechanical response. Resistance to stretch, shear, or bending deformations are key to model the fabric’s behavior. The process by which the digital fabric is adjusted to produce such life-like behavior is called mechanical estimation.
Achieving this level of fidelity through traditional mechanical capture devices is typically a labor-intensive process. Expert operators and specialized hardware are required to carry out physical testing and analysis of the fabric under a variety of conditions. Because of this, this time and resource-consuming process quickly becomes expensive and might be unfeasible if a large number of fabric samples needs to be analyzed.
The SEDDI Textura AI engine conveniently provides the necessary tools to simplify this task. SEDDI Textura uses basic and easy to obtain fabric metadata, such as structure, pattern, density, and thickness, to infer the mechanical parameters of the fabric. As a result, no experimental testing is required to determine the mechanical properties, providing rapid and cost-effective physical estimations. However, how good are Textura’s capabilities at estimating fabric properties? How can we quantify its accuracy in a meaningful way? How does it compare with traditional digitization methods?
This is where the Cusick Drape Test plays a crucial role: by subjecting digital fabrics to this rigorous assessment and evaluating their agreement with real-world fabric behavior, designers can be confident in the accuracy of their virtual designs.
Validating SEDDI Textura Physics Through Cusick Drape Tests
To ensure the reliability of this experiment, we carefully selected a wide range of fabrics with diverse combinations of weight, thickness, weave structure, and composition. This way, we aim to reduce any potential biases that our system might introduce due to the specificities of the SEDDI Textura AI algorithm.We’ve selected a set of 86 fabrics for this analysis, comprising 53 knits and 33 wovens. The most common weave and knit structures in this set are jersey (19%), twill (16%) and plain (14%). In terms of primary composition, cotton (50%) and polyester (12%) make up the majority of the fabrics in this set.


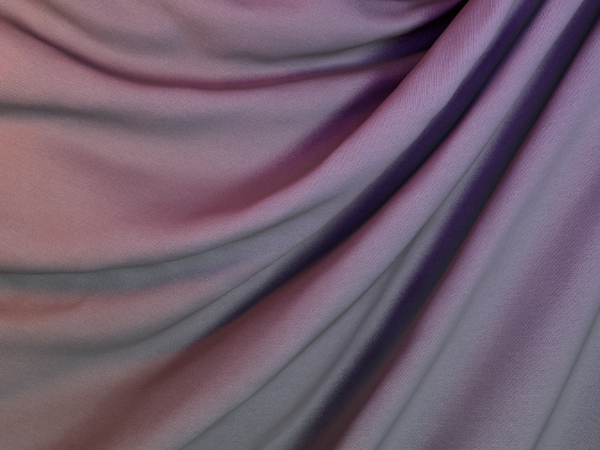
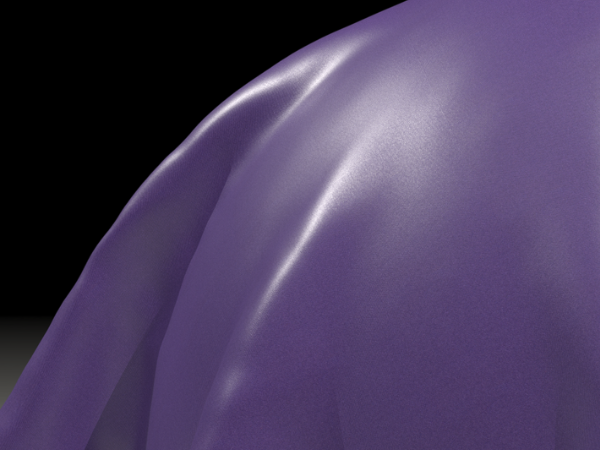
Figure 3. A small sample of the fabric set showcasing the diversity of materials used in the experiment.
To generate the ground-truth data, we performed the Cusick Drape Test on all 86 fabrics, running multiple trials with different 30cm diameter samples of each fabric to minimize biases and measure errors intrinsic to the process. We observed a mean variability of 2% in the measured drape coefficients between all tests of each fabric sample. The maximum observed variability was 8%.
We then digitized these fabrics using SEDDI Textura, but also using the CLO Kit and the Browzwear FAB digitization machines via different third party digitization labs. Having generated the fabric’s digital version, we then used CLO 3D and Browzwear VStitcher simulation software to digitally recreate the Cusick drape testing procedure.
Virtual Cusick Drape Test
We replicate the Cusick Drape Test in the virtual setting by creating a 30cm diameter circular fabric piece and fixing the nodes inside the central 18cm diameter circular region to mimic the constrained region of the real fabric when in between the two metal discs. We refrain from using cylindrical colliders since they are known to have inexact behaviors when sharp edges are present, as it would be the case with the thin metal disks.
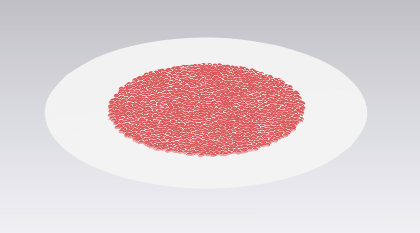
Figure 4. An example of the virtual Cusick setup in CLO 3D.
After setting the virtual fabric properties, we run a drape simulation and export the resulting fabric geometry. From this data we calculate the drape coefficient by projecting the contour of the geometry onto the plane parallel to the vertical axis (assuming gravity acts along the -Y axis, which means the projected contour lies on the XZ plane). This yields a 2D shape that describes the same shadowed contour that would be projected onto the paper sheet in a physical drape tester. From here, we simply calculate the area of the shape and compute the ratio as described in Figure 2.
Appendix A provides additional details on the virtual replica in each software, to ease the replication of our tests.
Results and Discussion
The plot in Figure 5 provides a comparison between the Drape Coefficients of real fabrics (Ground Truth), obtained using the real Cusick device, and the Drape Coefficient of the corresponding digital fabrics, digitized respectively with CLO Kit and with Textura AI. Notably, Textura AI achieves highly competitive results, with a mean error of ~11% with respect to ground truth, despite relying solely on fabric metadata. This is particularly impressive, as it is very close to the mean error of the fabrics digitized with the CLO Kit, with a difference that is well within the intrinsic error of the Cusick device itself (i.e. 2%).
Figure 6 offers a more detailed comparison of the mean error when categorizing the fabrics by their structure type. Both CLO Kit and Textura AI exhibit similar trends and variability, with SEDDI Textura slightly overestimating bending stiffness for woven fabrics, particularly those featuring a plain structure.
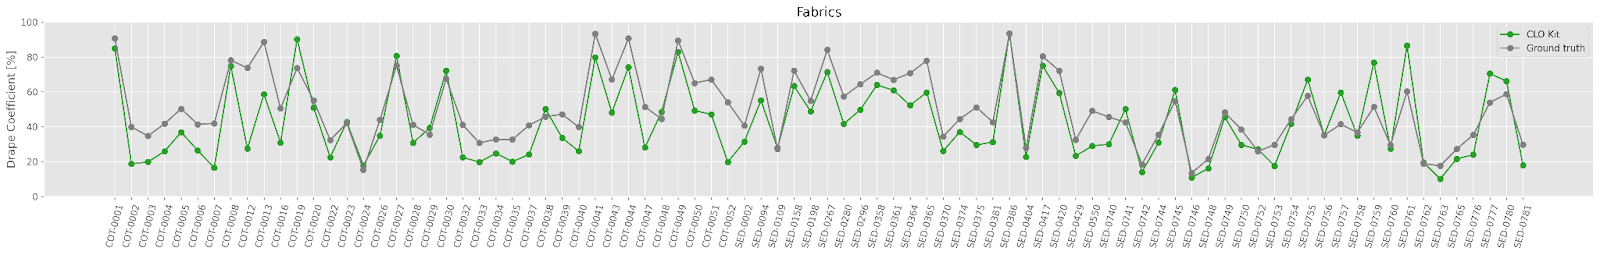

Figure 5. Plots comparing the mean ground-truth drape coefficient for each fabric to its SEDDI Textura and CLO Kit-digitized counterparts.
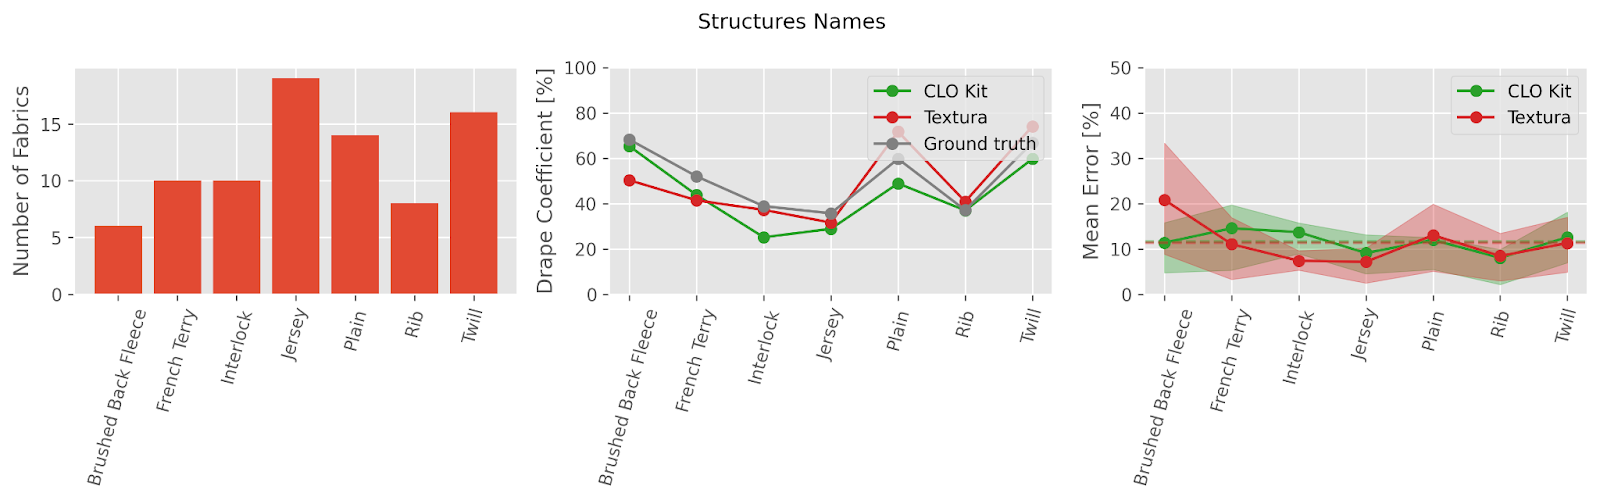
Figure 6. Mean error analysis for different structures for CLO Kit and SEDDI Textura. The left plot shows the data distribution. The central plot shows the mean drape coefficient. The right plot shows the mean error between the ground truth and the digitized fabrics. Solid lines represent the error value, dashed lines indicate the global mean, and the shaded area represents the interquartile range (IQR) of error.
Following the same methodology, Figure 7 shows the results when comparing the same ground truth data to Browzwear FAB and Textura-digitized fabrics in Browzwear VStitcher. Notably, Textura AI achieves higher accuracy, with a mean error of approximately 13%, largely outperforming FAB-digitized fabrics, which exhibit a mean error of around 25%. Our findings suggest that Browzwear’s FAB consistently underestimates bending stiffness by a nearly constant factor, resulting in lower drape coefficients. Figure 8 offers a more detailed comparison of the mean error when categorizing the fabrics by their structure type.
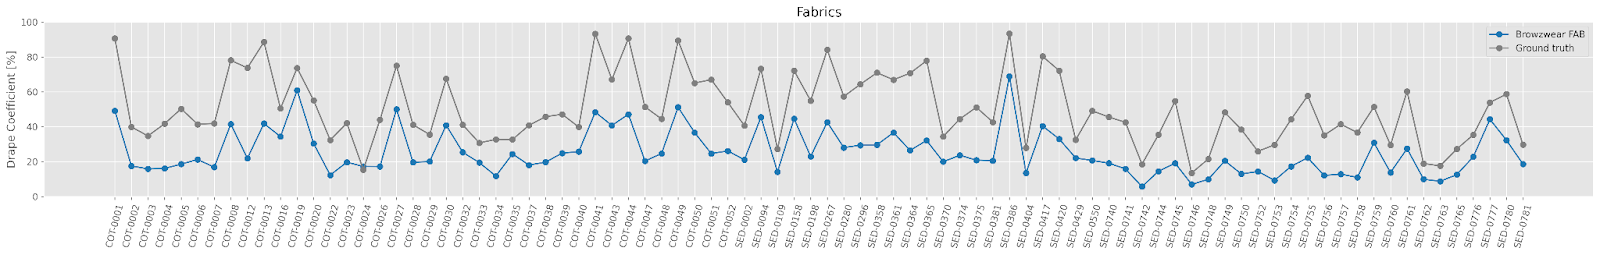

Figure 7. Plots comparing the mean ground-truth drape coefficient for each fabric to its Textura and Browzwear FAB-digitized counterparts.

Figure 8. Mean error analysis for different structures for Browzwear FAB and Textura. The left plot shows the data distribution. The central plot shows the mean drape coefficient. The right plot shows the mean error between the ground truth and the digitized fabrics. Solid lines represent the error value, dashed lines indicate the global mean, and the shaded area represents the interquartile range (IQR) of error.
Figure 9 presents a visual comparison of the drapes for three different fabrics (two knits and one woven) for both CLO and Browzwear using the different digitization procedures. The specific details on composition, density, and thickness can be found in Table 1. Notably, CLO Kit and Textura AI (both for CLO and Browzwear parameters) closely replicate the ground truth drape, resulting in similar drape coefficients. In contrast, the digitization provided by Browzwear FAB tends to underestimate the bending stiffness, leading to drapes with divergent shapes that deviate from the ground truth. This divergence is surprising, especially considering that VStitcher is indeed capable of simulating the drape correctly when it uses the mechanical parameters generated by Textura AI.
| ID | Name | Structure | Structure Name | Main Composition | Density (gsm) | Thickness (mm) |
|---|---|---|---|---|---|---|
| SED-0746 | Single Jersey VI 139gsm – Pastel Blue | Knit | Jersey | Rayon (100% Rayon) | 139 | 0.3 |
| SED-0757 | French Terry Mix 259gsm – Baby Pink | Knit | Terry | Cotton (27% Polyester, 27% Rayon, 6% Polyurethane Spandex, 40% Cotton) | 259 | 0.64 |
| COT-0020 | SK-2169-1 Brushed Back Fleece CO/WO – Navy/Black | Knit | Fleece | Cotton (33% Wool, 67% Cotton) | 330 | 1.14 |
Table 1. Specifications for fabrics shown in Figure 9.
 data for three fabrics")
Figure 9. Drape comparisons against the real (ground truth) data for three fabrics using the different digitization methods.
Conclusions
In this study, we evaluated SEDDI Textura’s mechanical digitization capabilities against traditional digitization methods. Our results demonstrate that Textura achieves highly competitive results, with a mean error of approximately 11%, matching the mean error produced by the CLO Kit. This is particularly impressive, given that Textura does not require experimental testing or fabric samples.
Our findings also highlight a possible limitation of the Browzwear FAB, which consistently underestimated bending stiffness in all the fabrics in our fabric dataset, resulting in lower drape coefficients. In contrast, Textura’s AI provided a much more accurate representation of fabric behavior.
It is worth noting that no digitization method is perfect: all of them carry some error, which is the product of both the digitization method itself and of the simulation engine behind the draping. This is the reason why two fabrics digitized using different methods should not be compared against each other, but should only be compared against the real fabric. Our research is ongoing, and we continue to explore new approaches to improve our digitization capabilities. Some of our findings are publicly available through our academic publications, including our recent peer-reviewed academic paper “Practical Method to Estimate Fabric Mechanics from Metadata” by Dominguez-Elvira et al.
Appendix A: Virtual Cusick Drape in CLO 3D and Browzwear VStitcher
Cusick Simulation in CLO 3D
To replicate the Cusick Drape Test within CLO 3D, we create a 30cm diameter circular fabric piece and define an 18cm diameter interior line to guide node placement (Figure A1). Using the Pin (Lasso) tool, we fix all nodes within the interior line, then remove it to prevent fabric remeshing. Next, we adjust the cloth’s physical parameters or load the.zfab file with all the mechanical information. With the nodes fixed, we run the simulation process using the Fitting (Accurate Fabric) settings (Figure A2) and export the fabric geometry to file. We run this procedure for both CLO Kit- and Textura-digitized fabrics.
We then use these geometries to calculate the drape coefficients. To do so, we project the contour of the geometry onto the plane parallel to the vertical axis (assuming gravity acts along the -Y axis, which means the projected contour lies on the XZ plane). This yields a 2D shape that describes the same shadowed contour that would be projected onto the paper sheet in a physical drape tester. From here, we simply calculate the area of this shape and compute the ratio as described in Figure 2.
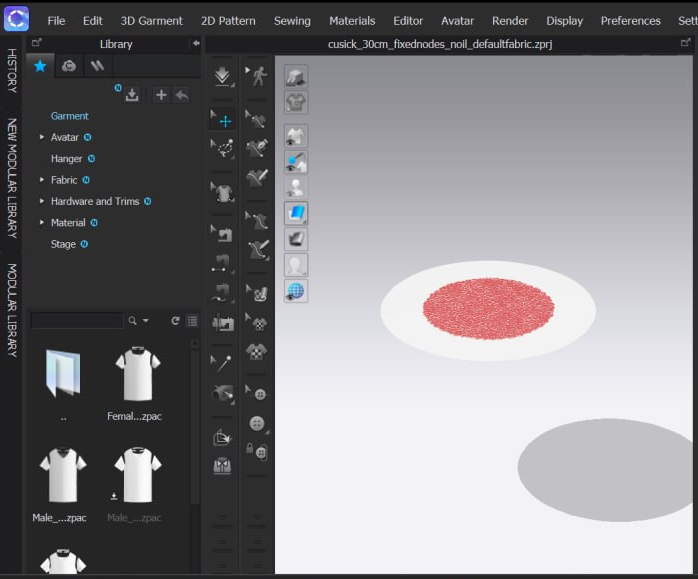
Figure A1. Cusick Drape Test setup in CLO 3D. A 30cm diameter circular fabric piece with nodes fixed within an 18cm diameter region (colored in red).
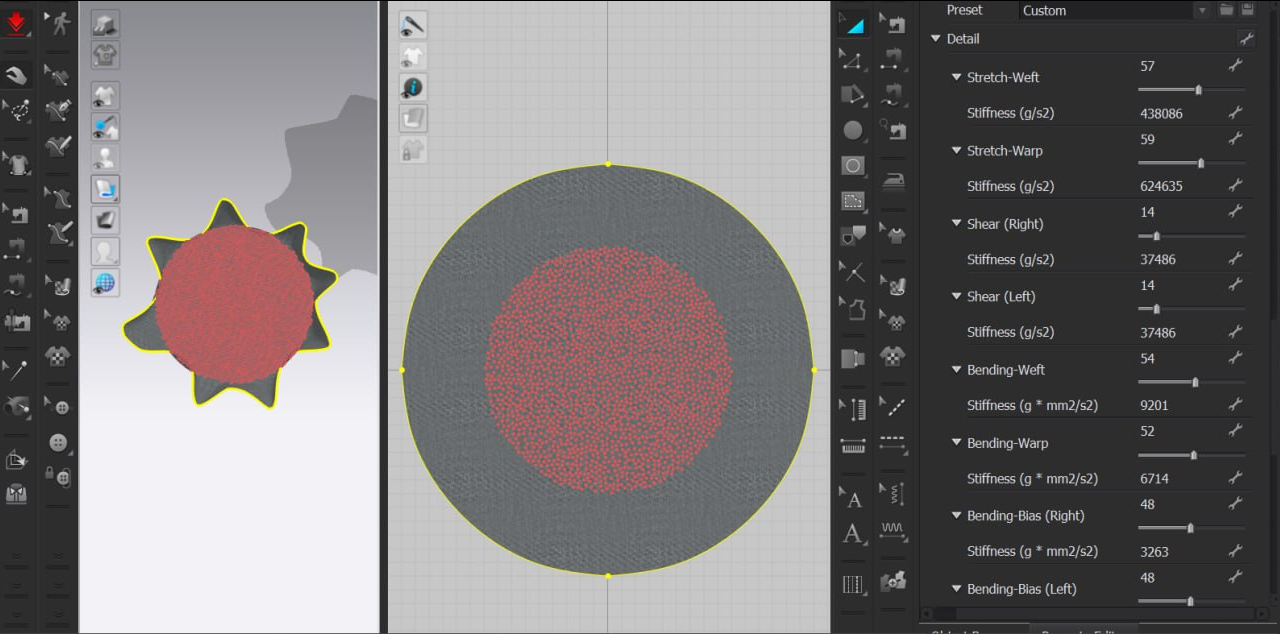
Figure A2. Simulation of the Cusick Drape Test in CLO 3D. The resulting contour is visible, allowing for the calculation of the drape coefficient.
Cusick Simulation in Browzwear VStitcher
We replicate the Cusick Drape Test within VStitcher by creating a 30cm diameter circular fabric piece and defining an 18cm interior line to represent the support disc (Figure A3). Unlike CLO 3D, the presence of this interior line does not affect the meshing and can be kept as reference through the entire run to simplify the node fixing procedure.
After adjusting the fabric’s physical and meshing properties, we click on “Prepare” to bring the fabric to the 3D viewport. We then use the Styling Tool to paint the circular area of the support disc and fix the associated nodes by selecting the Hold option, ensuring this region remains frozen throughout the simulation. With the nodes fixed, we run the simulation with the Auto-Fast Simulation setting disabled to ensure maximum quality, and export the draped fabric geometry to file for analysis. We run this procedure for both FAB- and Textura-digitized fabrics.
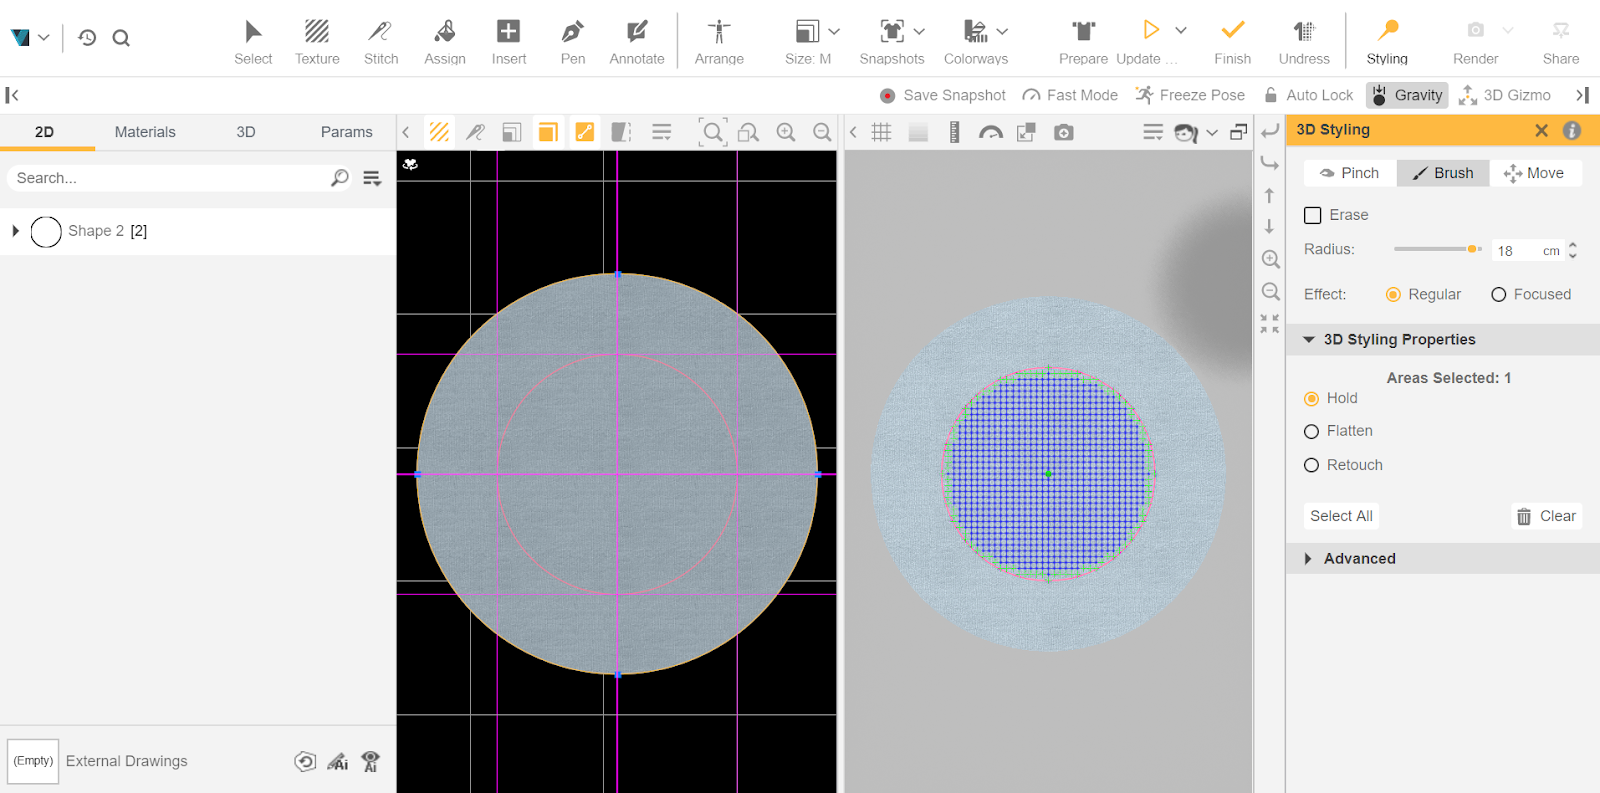
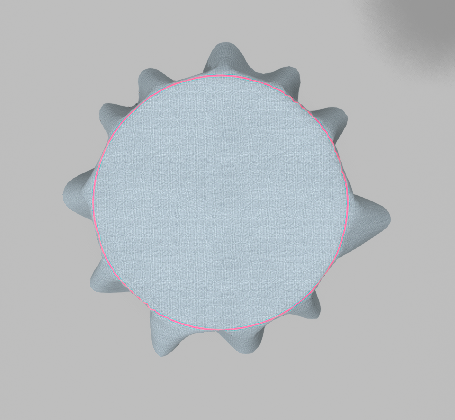
Figure A3. Simulation of the Cusick drape test in Browzwear VStitcher. The resulting contour is visible, allowing for the calculation of the drape coefficient.
Appendix B: Direct vs Projected Contour Estimation in the Cusick Drape Test
The traditional method for estimating the shadowed area in Cusick Drape Tests involves manually tracing the casted shadow onto a ring of paper, cutting out the contour, and weighing the cutout. Since the mass density of the paper is known, the area of the shadow can be calculated. However, this method is susceptible to human error and is time and material-consuming.
To overcome these limitations, the procedure can be automated using computer vision. This is the strategy we follow. After careful camera calibration, we capture a photo of the shadowed area and use an image processing algorithm to identify the contour (Figure B1).

Figure B1. Example of shadowed contour estimation using our computer vision algorithm. The original photograph (left) undergoes a segmentation procedure (middle) to identify the pixels corresponding to the fabric. Finally, this segmentation is used to generate the contour (right), from which the drape coefficient is estimated.
By relying on the projected shadow rather than direct photography of the draped fabric, we avoid potential distortions caused by perspective: the parabolic mirror ensures that light rays emitted from the punctual source become collimated, effectively resulting in an orthographic projection of the silhouette.